Value-Based Care & The Illusion of Improvement
Turning Healthcare into a High-Stakes Game of Metrics and Madness
This is the second article in my series on Value-Based Care. It builds upon my previous article, “From Doctors to Social Workers,” to help lay the foundation for understanding healthcare’s current landscape and how it affects primary care. If you have not read the first article, I strongly encourage you to do so.
The video version of this article is embedded below and on my YouTube Channel.
Audio podcast and Video versions are also available on the Podcasts Page.
On to the article.
Historical Origin of Value-Based Care (VBC)
Those who cannot remember the past are condemned to repeat it.
George Santayana
It is challenging to pinpoint the origin of VBC, but it has existed in one form or another since the early 1900s.
In the 1960s, Patient-Centered Medical Homes (PCMH) originated in pediatrics to care for children with complex illnesses. PCMH (and its precursors) focused on ensuring that there was adequate infrastructure, making recommendations for improving infrastructure (if needed) and processes to ensure that participating medical offices consistently delivered “high-quality care.”
In contrast, Health Maintenance Organizations (HMOs) were the invention of insurance companies. HMOs were designed to control the total cost of care delivered to employees. In fact, the “prepaid health plans” popular in the early 1900s were a precursor to HMOs. Over time, as the cost of medical care increased, there was a proliferation of HMO plans, which decreased provider reimbursement (or required providers to deliver more care for the same fees) and reduced the medical care people could receive. These “insurance benefits and carve-outs” eventually became confusing, and people often found themselves without medical coverage. The HMO Act of 1973 aimed to curb several of these abuses by insurance companies by requiring them to cover a more comprehensive set of medical services. HMO plans became more popular after government regulation, but their popularity declined in the 1990s. The reasons for this decline are similar to those being echoed by doctors, health organizations, and patients today—declining reimbursement and denial of coverage for medical services.
The reasons for the decline in HMO popularity are similar to those echoed by doctors, health organizations, and patients today—declining reimbursement and denial of coverage for medical services.
Remember George Santayana’s quote above? If you can make money, then the memory of the past fades very quickly.
Pay for Performance (P4P)
In March 2001, the Institute of Medicine (IOM) released its report: Crossing the Quality Chasm: A New Health System for the 21st Century. This study grabbed national attention as it highlighted the vast gap in the quality of care Americans received compared to NHS in the United Kingdom.1
This report led to the rise of the Pay-for-Performance model, which provides financial incentives to providers, in addition to fee-for-service (FFS), to meet quality thresholds.2
CMS started experimenting with P4P in 20033 and officially launched the Patient Quality Reporting Initiative (PQRI) in 2007. Employers started demanding better “quality of care” for their employees, hoping it would reduce their healthcare costs. This led private insurance companies to include P4P in their contracts.4 Given the media attention, the number of quality metrics in these insurance contracts started skyrocketing to over 100 for some health organizations as each insurance company instituted its own set of quality metric requirements. Almost all these quality metrics were directed toward Primary Care Physicians.
Given the proliferation of quality metrics, in 2011 CMS attempted to standardize quality reporting by making PQRI mandatory. To reflect this change, PQRI was renamed to Patient Quality Reporting System (PQRS). In addition to jumping on the quality bandwagon, CMS hoped private insurance companies would streamline their quality requirements and base them on PQRS.
With this historical foundation in place, let's examine how modern VBC attempts to address these longstanding challenges...
What is Value-Based Care (VBC)?
The best description of “modern” VBC was published in 2006 by Michael Porter and Elizabeth Teisberg's book: Redefining Healthcare.
Based on his book, Porter defined the “Value Equation” succinctly in his NEJM article5 as:
In this Value Equation, “Outcome” and “Cost” are defined as:
Outcomes: an attempt to measure if the person benefitted from treatment. They are specific to a single healthcare condition and are multidimensional, i.e., several outcomes are required to capture the results of care.
Health condition = back pain,
Multidimensional outcome: pain-free days, absent days from work, use of painkillers, emergency room or hospital visits for back pain
Cost: refers to the total costs of the entire care cycle for the patient’s medical condition, not the cost of individual services. E.g., the total cost to treat back pain for an entire year instead of the cost of individual office visits, ER, or hospital visits.
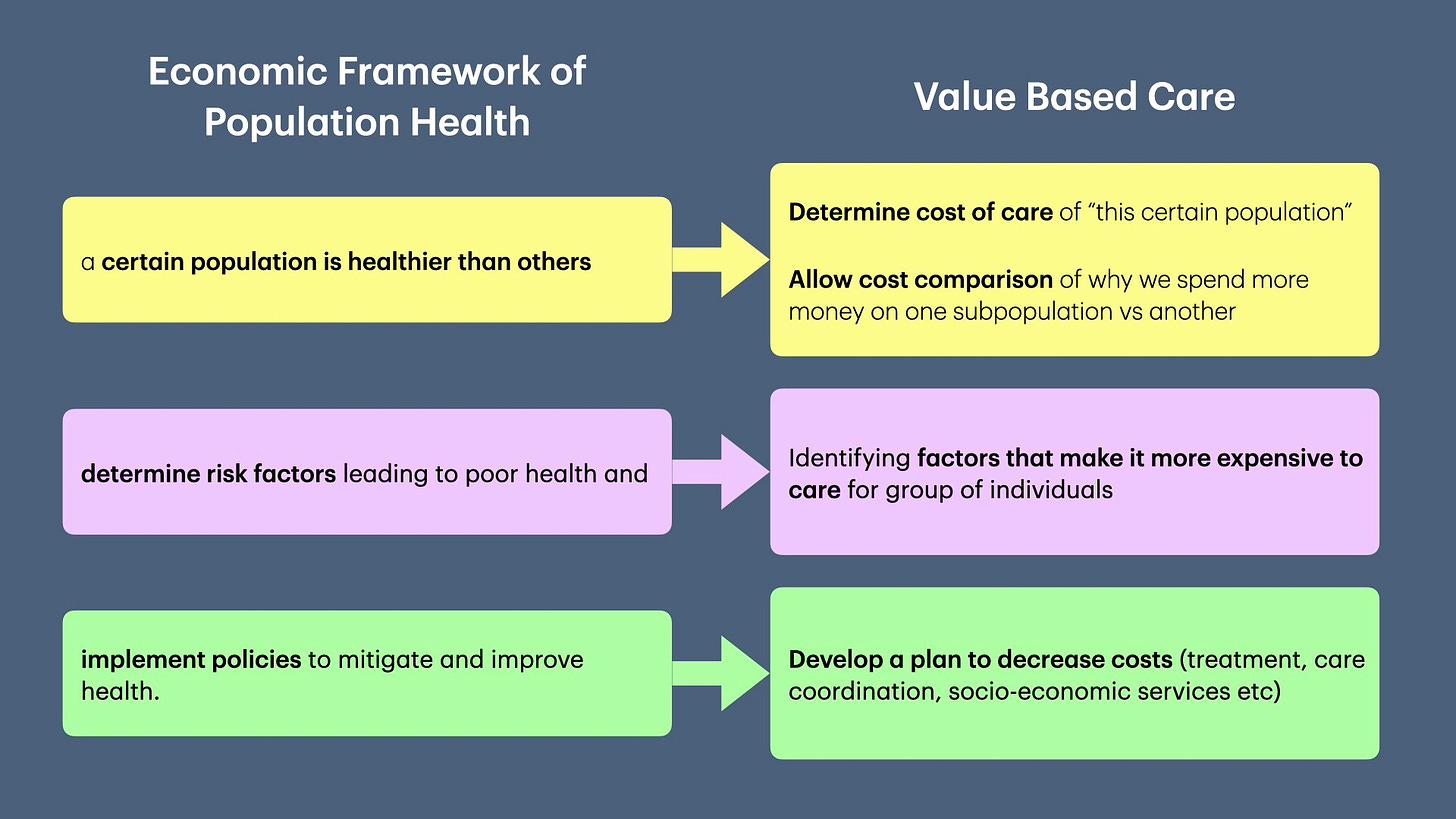
Although PCMH and P4P preceded VBC, Population Health established the modern foundation for Value-Based Care.
Measuring “Value” in a single individual is hard, as every individual is different. However, the economic framework of Population Health allows for the measurement of “Value” in a “group of individuals.”

Organizing healthcare around the “Value Equation” was a bold and radical proposal, but implementing it proved challenging without any incentives.
Enter the Affordable Care Act!
Affordable Care Act (ACA)
In 2010, the Affordable Care Act (pdf link) enacted several provisions to improve healthcare—and provide incentives to implement VBC.
The ACA created two entities that catapulted VBC and radically reshaped reimbursement to providers:
Accountable Care Organizations (ACOs): An ACO is a network of providers (e.g., hospitals, PCPs, specialists, imaging centers, urgent care) that agree to work together and take responsibility to improve quality and reduce the cost of care for the attributed population.
Center of Medicare and Medicaid Innovation (CMMI): An innovation arm of CMS funded with $10 billion every 10 years to develop, test, and promote innovative payment and delivery models.
Since its creation, CMMI has experimented with several Value-Based Care models in an attempt to reduce healthcare costs.6
Medicare Access and CHIP Reauthorization Act (MACRA)
In 2015, CMS consolidated the various quality programs when it passed MACRA. Building upon the ACA, CMS created two programs:
Merit Based Incentive Payment System (MIPS): the successor to PQRS for individual practices.
Alternative Payment Model (APM): allowed groups of Clinically Integrated Networks, i.e., ACOs, to report Quality as a group AND participate in a risk-based contract with Medicare, e.g., Medicare Shared Savings Program. (Risk-based contracts are explained below).
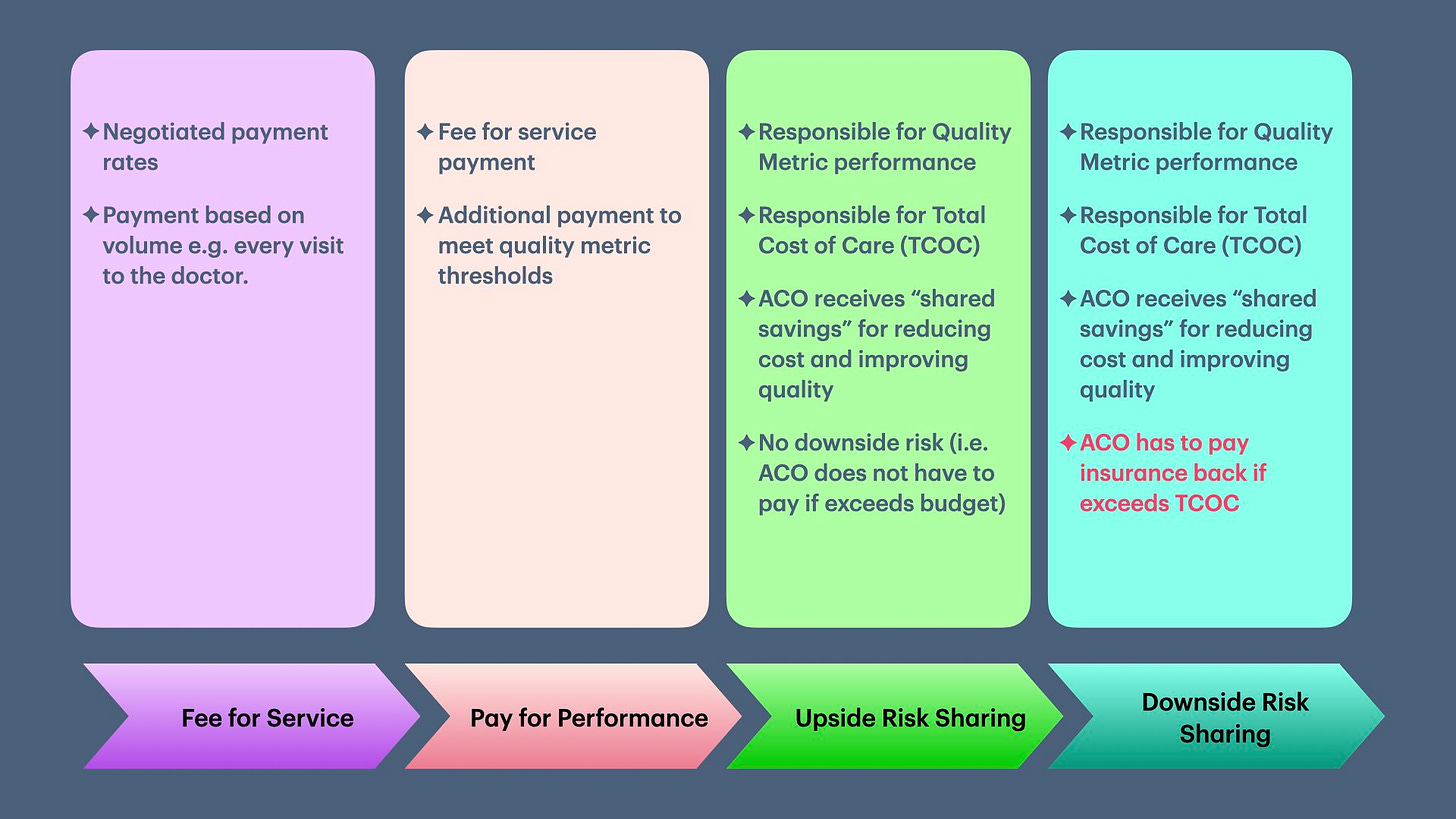
Taking the cue from CMS, private insurers started requiring ACOs to sign VBC-style contracts in the last 10 years. The general progression of VBC contracts is depicted in the picture below:
What does a Value-Based Contract Look Like?
Value-based contracts are also called risk-based contracts. At the most basic level, there are two components to this style of contract:
Fixed budget to deliver care to a population (aka attributed lives).
Performance on quality metrics based on targets set by the contract.
(We will not discuss bundled payment contracts in this newsletter).
Let’s break this apart:
Attributed Lives
The population on which the budget is based is called “Attributed Lives” or “Covered Lives.” The simplest way to determine attributed lives is to:
List all primary care providers (PCPs) participating in an ACO.
The panel of patients these participating PCPs provide ongoing care.
While on the surface, this seems simple, it can get complicated very quickly. A few complicating issues are:
Who is considered a PCP? E.g., Are gynecologists considered PCP when they provide care to women?
How are new patients handled in attribution?
What about patients who moved to a different town?
(I will discuss “Patient Attribution” in the following newsletter.)
Determine Fixed Budget
The budget is determined using a combination of the following:
Risk of getting sick, a.k.a. preexisting conditions. This predicts how much healthcare the patient is expected to utilize. This is typically based on diagnosis codes doctors submit to insurance companies in their bills.
Patient demographics—age, sex, residence status (e.g., community, nursing home), and disability status (e.g. on dialysis).
The cost to deliver care to a similar population.
As you can see, the only control providers have under a “risk-based contract” is to ensure they correctly document and bill for every medical diagnosis (even if it is not clinically relevant). Without proper “risk adjustment,” the allocated budget will be lower, making it difficult, if not impossible, to succeed in VBC contracts.
(Risk adjustment is a subject matter for another future newsletter.)
Performance on Quality Metrics
The reason for including Quality Metrics in VBC contracts was not to repeat the mistakes of HMO contracts, i.e., ensuring people received appropriate care for essential services.
A typical VBC contract has three items:
List of Quality Metrics (based on the HEDIS measure set).
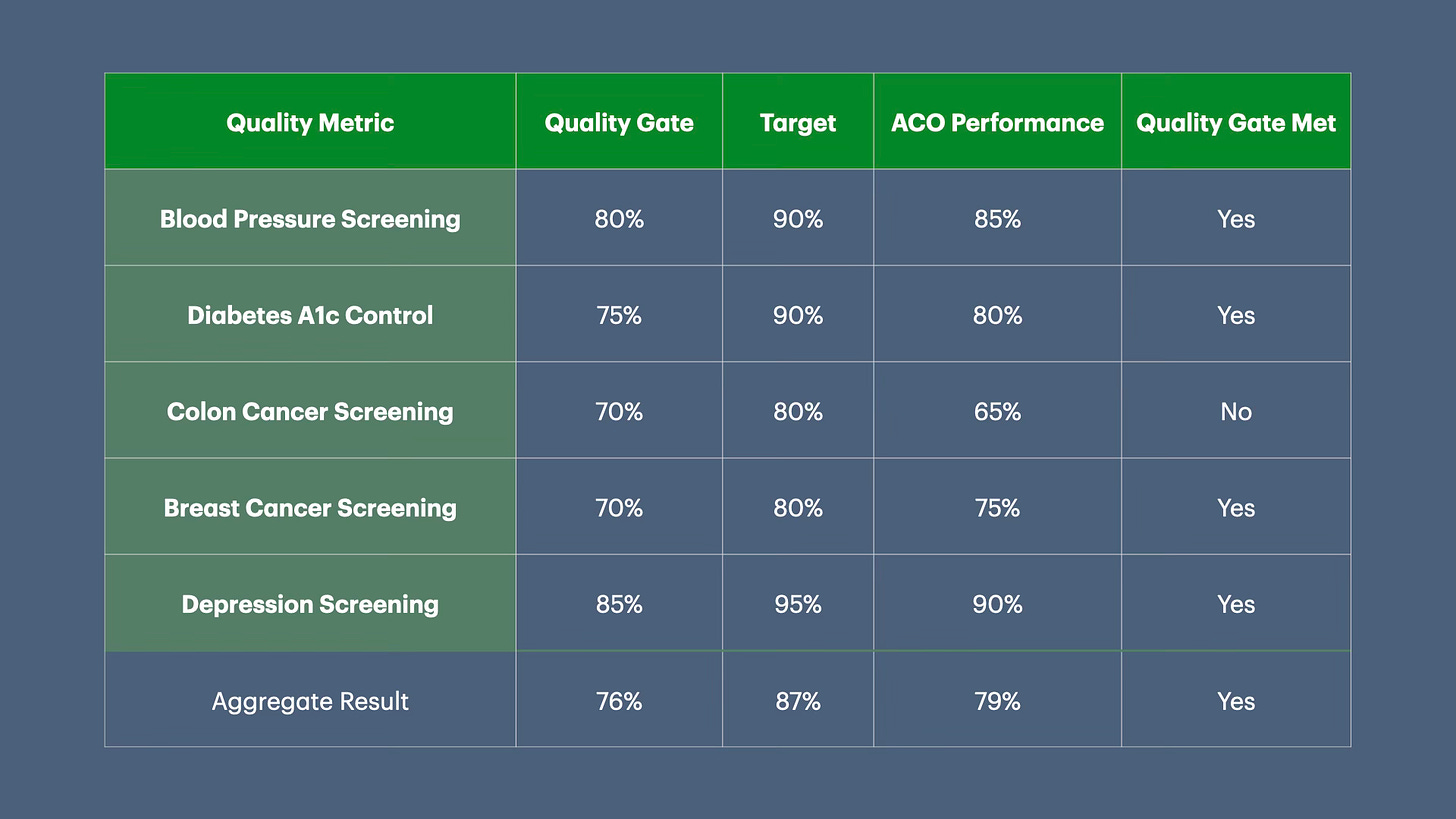
Quality gate, i.e., the percentage threshold the ACO needs to achieve to receive any “shared savings”7 (i.e., money saved by reducing the cost of care) from the insurance company.
Target percentage on each quality metric (or stretch goal)
The insurance company sets a percentage of shared savings the ACO can earn on meeting the quality gate. That % shared savings increases if performance exceeds the “quality gate” till ACO reaches the target percentage.
Let's say that in a VBC contract, the insurance company will share 50% of the shared savings and an additional 1% for performance on quality above and beyond the quality gate (76% in the table above) till the target threshold (87%).
Given that ACO performance in the table is 79%, the total shared savings the ACO will earn is 53% of shared savings (50% on meeting the quality gate and an additional 3% for improving performance ).
The above example is a simplification. ACOs and health insurers negotiate several details, including:
Quality gate percentage.
Target Percentage.
The number of quality gates, e.g., ACO needs to meet the quality gates for 3 out of 5 metrics to qualify.
Aggregate quality gate, i.e., when percentages are averaged across all quality metrics, ACO meets the aggregate quality gate.
Percent increase in shared savings with the percent increase in quality performance.
As you can see, VBC contracts can get complicated very quickly.
The burden of VBC contracts, i.e., cost and quality control, falls on primary care, as patient attribution is determined based on the PCP panel. Furthermore, given the complexity of VBC contracts, small PCP practices don’t have the expertise, time to understand, and negotiate these contracts. Their options include selling their practice, joining larger practices, or joining an existing ACO.
The burden of VBC contracts falls on primary care. Their options include selling their practice, joining larger practices, or joining an existing ACO.
These complicated contracts create the illusion of improving care while reducing access to primary care, and making healthcare worse for the population.8
Up Next
Now that we understand VBC, in the following newsletter, we will look at a topic that seems simple on the surface but gets complicated very quickly—“Patient Attribution.”
If you liked this article, please consider sharing it.
An interesting counterpoint to the inherent belief that the American Health System is much better than UK’s NHS “socialized” health care when the NHS delivers much better care!
Most insurance companies just repackaged the increase in regular fees that providers would have received to account for inflation into bonuses. So if there was a 2% inflation from 2005 to 2006, instead of increasing the payment to doctors by 2%, doctors could earn a 1% bonus if they met quality.
Sura, A., & Shah, N. R. (2010). Pay-for-Performance Initiatives: Modest Benefits for Improving Healthcare Quality. American health & drug benefits, 3(2), 135–142.
Roble D. T. (2006). Pay-for-Performance Programs in the Private Sector. Journal of oncology practice, 2(2), 70–71. https://doi.org/10.1200/JOP.2006.2.2.70
Porter, M. E. (2010). What Is Value in Health Care? New England Journal of Medicine, 363(26), 2477–2481. https://doi.org/10.1056/NEJMp1011024
Lewis, C., Abrams, M., Seerval, S., Horstman, C., & Blumenthal, D. (2022, April 28). The Impact of the Payment and Delivery System Reforms of the Affordable Care Act. The Commonwealth Fund https://www.commonwealthfund.org/publications/2022/apr/impact-payment-and-delivery-system-reforms-affordable-care-act
Shared Savings = Budget - Total Cost of Care in 1 year
Rooke-Ley, H., Song, Z., & Zhu, J. M. (2024). Value-Based Payment and Vanishing Small Independent Practices. JAMA, 332(11), 871–872. https://doi.org/10.1001/jama.2024.12900
Ryan, A. M., & Markovitz, A. A. (2023). Estimated Savings From the Medicare Shared Savings Program. JAMA Health Forum, 4(12), e234449. https://doi.org/10.1001/jamahealthforum.2023.4449


